
|
Interdiciplinary - Human Geography.docx Size : 12.134 Kb Type : docx |
ePortfolio Assignment
Link: https://arcg.is/09unbu
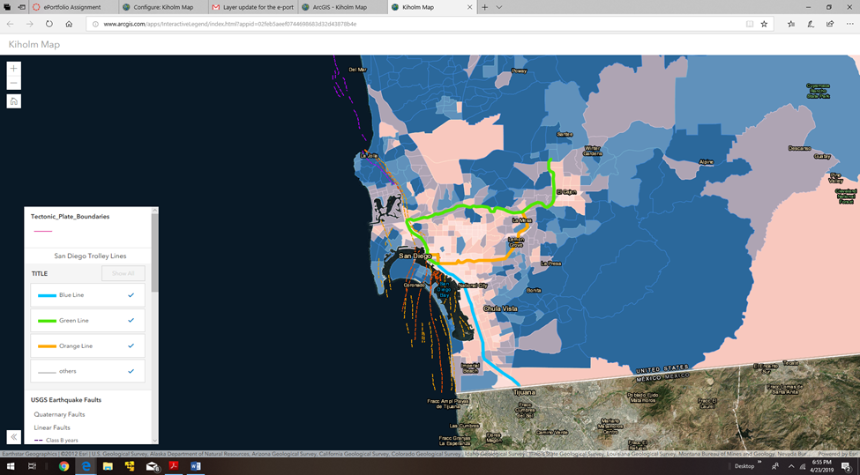
The map I created for this Human Geography 1400 course is concentrated on the west coast of the United States. There are a total of 4 different layers that identify San Diego trolley lines, USA median household incomes, tectonic plate boundaries, and USGS earthquake faults. The first map layer I added was the San Diego Trolley layer. The information that could be obtained from it includes the locations of the trolley lines, and stations in the greater San Diego area. I wasn’t aware that San Diego had trolley lines before this assignment. When I think about trolley systems I think of San Francisco. I have been to San Diego several times and have never seen the trolleys.
The second layer I added to my map was the USA median household income. You can click on any blocked area and see what the median income is. The lighter the color the lower the income. I was surprised to see that a great deal of the areas with the highest median income were located inland away from the coast. However there were several beach front locations that had the highest income rating. It makes sense as the most desirable areas on the coast would command the highest property values. For instance the areas around Balboa Peninsula and Newport Beach have a median income rating of around 150,000/yr. I’m sure there are many that far exceed those numbers as there is obviously a great deal of wealth in that area.
The area displayed in my map is a hotspot for tectonic activity, so it seems only fitting to have a layer that represents the tectonic plate boundaries. By using this map layer a person could see where the plate boundaries lie in relation to the west coast area that is displayed. The west coast is in fact a plate boundary that separates oceanic crust to the west from continental crust to the east. The interaction of these plates is the reason there is so much volcanic activity along the west coast of the United States. The oceanic plate to the west is being sub-ducted beneath the continental plate to the east. My map is set up so you can actually see the tectonic plate boundaries for the entire earth if desired.
With all of the geologic activity in the west coast area, you definitely have to include a map layer that show all of the earthquake fault areas. There are different types of faults in the displayed areas. The first are quaternary faults, or faults with many segments. The San Andreas Fault is a perfect example of this fault type. Another type is called a linear fault. A rift valley is a linear-shaped lowland between several highlands or mountain ranges created by the action of a geologic rift or fault. There are a huge amount of earthquake faults off the coast of San Diego as seen in my map. I have included a couple of screen shots of the maps I created below.

|
|
SLCC Geography 1400 E-Portfolio Assignment Reflection.docx Size : 15.365 Kb Type : docx |
E-Portfolio Assignment Reflection
https://arcg.is/09unbu
I have really enjoyed this e-portfolio assignment. The ArcGIS mapping site is fun to play with, and is very educational as well. The information that can be obtained from the e-portfolio map I created could be used in a variety of general education courses. For instance, if you were taking a class on earthquakes and volcanos the map would be useful in finding the areas that are most prone to this activity.
Perhaps if you were taking a course that included the study of, or applications of urban infrastructure, this map could be useful in learning more about the most effective areas for mass transit facilities installation. The median income map layer would be useful in determining where to set up hospitals, homeless shelters, low income housing, Planned Parenthood clinics, apartment complexes and custom homes for the wealthy, or even grocery stores. There would be many applications of this map layer.
I have been attending SLCC with the intention of obtaining a degree in Computer Aided Drafting and Design / Architecture. Some of the applications of this technology include drawing up plans for buildings, city parks and infrastructure. Many of these computer aided drafting (CAD) drawings could be implemented into the ArcGIS mapping site, or created by accessing various information from the site. The use of satellite images would be invaluable for many aspects of computer designed projects. This technology is advancing rapidly, and is clearly here to stay. It would be wise to educate yourself on the use and implementation of it. Especially if you are looking for a career that is stable and in demand.
I have thoroughly enjoyed this course this semester. I have never seen the ArcGIS site. It’s like google earth on steroids! I was totally amazed at the amount of information that is readily available for just about any application. I have learned much about the geographic aspects of the world and how they affect all of us in many ways. Courses like this one make college fun!